Jonathan Davenport
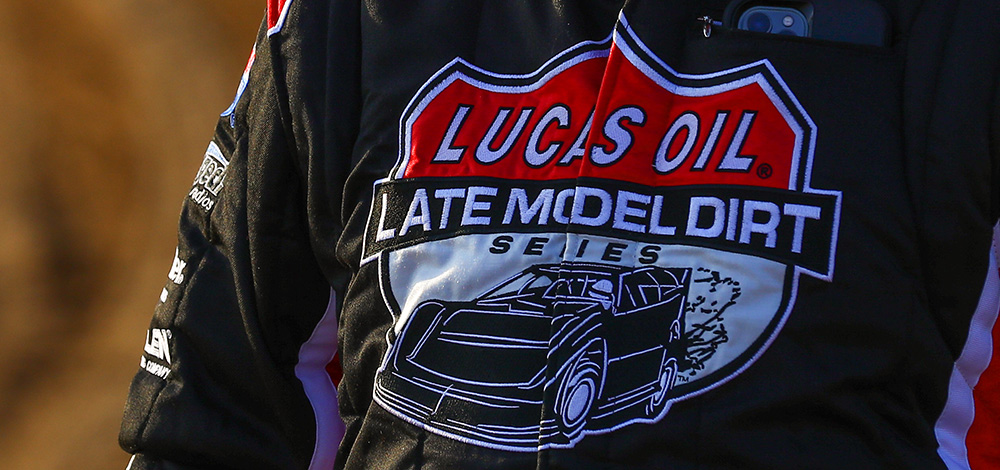
Lucas Oil Late Model Dirt Series
Driver Stats All Races
Race Count: 269
Feature Wins / Win Percentage : 45 / 16.73%
Laps Led: 2734
Races with laps led: Stat
Top Fives / Percentage : 149 / 55.39%
Top Tens / Percentage : 207 / 76.95%
Last 5 Average Finish: 8
Last 10 Average Finish: Stat
Average Feature Finish: 6.9326
Average Feature Start: 7.3596
Qualifying Average: 1.0000
Money Won: $1,860,805
Total Feature Plus/Minus: Stat
Races with Positive +/-: Stat
Hard Chargers: 15
Total Heat Race Plus Minus: Stat
Heat Wins: 127
Quick Times: 59
Top 5 Efficiency (St/Fin/%): Stat
Top 10 Efficiency (St/Fin/%): Stat
1/2 Mile (Avg Finish/Wins): Stat
3/8 Mile (Avg Finish/Wins): Stat
4/10 Mile (Avg Finish/Wins): Stat
1/3 Mile (Avg Finish/Wins): Stat
3/10 Mile (Avg Finish/Wins): Stat
1/4 Mile (Avg Finish/Wins): Stat
7/16 Mile (Avg Finish/Wins): Stat
5/8 Mile (Avg Finish/Wins): Stat
B-Main/LCS Appearances: Stat
Legend
Better Than 2021 Average:
Worse Than 2021 Average:
Better Than Total Average:
Worse Than Total Average:
Worse Than 2021 Average:
Better Than Total Average:
Worse Than Total Average:
Driver Stats 2025
Race Count: 50
Feature Wins / Win Percentage: 9 / 18.00%
Laps Led: 727
Races with laps led: Stat
Top Fives / Percentage: 35 / 70.00%
Top Tens / Percentage: 43 / 86.00%
Average Feature Finish: 5.5800
Average Feature Start: 5.2400
Qualifying Average: 1.0000
Money Won: $469,900
Total Feature Plus Minus: Stat
Races with Positive +/-: Stat
Hard Chargers: 3
Total Heat Race Plus Minus: Stat
Heat Wins: 29
Quick Times: 17
Top 5 Efficiency (St/Fin/%): Stat
Top 10 Efficiency (St/Fin/%): Stat
B-Main/LCS Appearances: Stat
Driver Stats 2024
Race Count: 49
Feature Wins / Win Percentage: 9 / 18.37%
Laps Led: 471
Races with laps led: Stat
Top Fives / Percentage: 31 / 63.27%
Top Tens / Percentage: 41 / 83.67%
Average Feature Finish: 5.9388
Average Feature Start: 6.4286
Qualifying Average: 1.0000
Money Won: $384,375
Total Feature Plus Minus: Stat
Races with Positive +/-: Stat
Hard Chargers: 3
Total Heat Race Plus Minus: Stat
Heat Wins: 27
Quick Times: 11
Top 5 Efficiency (St/Fin/%): Stat
Top 10 Efficiency (St/Fin/%): Stat
B-Main/LCS Appearances: Stat
Driver Stats 2023
Race Count: 52
Feature Wins / Win Percentage: 7 / 13.46%
Laps Led: 594
Races with laps led: Stat
Top Fives / Percentage: 29 / 55.77%
Top Tens / Percentage: 41 / 78.85%
Average Feature Finish: 7.1538
Average Feature Start: 7.0385
Qualifying Average: 1.0000
Money Won: $263,315
Total Feature Plus Minus: Stat
Races with Positive +/-: Stat
Hard Chargers: 1
Total Heat Race Plus Minus: Stat
Heat Wins: 23
Quick Times: 8
Top 5 Efficiency (St/Fin/%): Stat
Top 10 Efficiency (St/Fin/%): Stat
B-Main/LCS Appearances: Stat
Driver Stats 2022
Race Count: 29
Feature Wins / Win Percentage: 9 / 31.03%
Laps Led: 476
Races with laps led: Stat
Top Fives / Percentage: 19 / 65.52%
Top Tens / Percentage: 27 / 93.10%
Average Feature Finish: 4.5172
Average Feature Start: 6.0000
Qualifying Average: 1.0000
Money Won: $382,725
Total Feature Plus Minus: Stat
Races with Positive +/-: Stat
Hard Chargers: 2
Total Heat Race Plus Minus: Stat
Heat Wins: 15
Quick Times: 6
Top 5 Efficiency (St/Fin/%): Stat
Top 10 Efficiency (St/Fin/%): Stat
B-Main/LCS Appearances: Stat
Driver Stats 2021
Race Count: 42
Feature Wins / Win Percentage: 8 / 19.05%
Laps Led: 264
Races with laps led: Stat
Top Fives / Percentage: 19 / 45.24%
Top Tens / Percentage: 28 / 66.67%
Average Feature Finish: 8.8049
Average Feature Start: 9.0244
Qualifying Average: 1.0000
Money Won: $216,570
Total Feature Plus Minus: Stat
Races with Positive +/-: Stat
Hard Chargers: 4
Total Heat Race Plus Minus: Stat
Heat Wins: 16
Quick Times: 10
Top 5 Efficiency (St/Fin/%): Stat
Top 10 Efficiency (St/Fin/%): Stat
B-Main/LCS Appearances: Stat
Driver Stats 2020
Race Count: 47
Feature Wins / Win Percentage: 3 / 6.38%
Laps Led: 202
Races with laps led: Stat
Top Fives / Percentage: 16 / 34.04%
Top Tens / Percentage: 27 / 57.45%
Average Feature Finish: 9.0652
Average Feature Start: 10.3913
Qualifying Average: 1.0000
Money Won: $143,920
Total Feature Plus Minus: Stat
Races with Positive +/-: Stat
Hard Chargers: 2
Total Heat Race Plus Minus: Stat
Heat Wins: 17
Quick Times: 7
Top 5 Efficiency (St/Fin/%): Stat
Top 10 Efficiency (St/Fin/%): Stat
B-Main/LCS Appearances: Stat
Driver Feature Results By Date |
▲ shows races with laps led
Date
Track
Finish